Showing posts with label testing. Show all posts

Tuesday, September 15, 2015

Paddle Mate Beta Access

I made good progress on the Paddle Mate "Just Ship It" Release this past weekend. I had to step back, look at my activity state restoration code and fix a couple key problems. With that under control the app is handling backgrounding much better now.

This Beta version also includes:

  • App setting persistence so that the app remembers your last used workout settings (track location, Microsoft Band pairing options)
  • The DOCK view (main landing view of app) now includes a preview of the map from your last workout and some stats from the workout.
  • State Restoration.

With these changes in place, the app is ready for wider Beta Testing. If you are interested in trying out Paddle Mate before I ship it then you can sign up at: Announcing Beta Access to Paddle Mate

Thursday, October 16, 2014

Software Development is Obviously Hard

Look at Apple's recent iOS 8.0.1 release that broke cellular.
Look at (any company's I have used) Wi-Fi or Bluetooth stack and how flaky it is every other release.

The technology we use, rely on, love, and spend a lot of money on each day is a big let down when it fails. For non-techies I hear them blaming themselves. They must not be using it right.

Here's a secret though, most times when it is not working, but it worked yesterday or 5 minutes ago, it isn't you, it's the gadget. How many times have you cycled your WiFi or Bluetooth off/on to try to fix connectivity? Too many.

I feel for the people that don't know this much (you sometimes have to reset things).

It used to be a big joke, and I made it plenty of times, that you had to restart your Windows PC daily or whenever it started to act strange.

The bigger joke today is that we have to do that to the device in our pocket more often than we care to admit.

I always think, maybe it's me and the stuff I am interfacing with each day. Bluetooth headsets, in-car bluetooth, switching multiple networks, installing/uninstalling apps. My day to day usage of mobile devices is a little more extreme than the average user I figure and so I run into "edge cases" all the time.

Or maybe, we just need to spend some more time polishing our software before pushing it out the door.

Wednesday, August 27, 2014

I Have to Hire an SDET (Software Development Engineer Test) for iOS, What Should I Ask?

One, of many, of our beach rock finds.
This was the question I got a few weeks back when an acquaintance from Xcoders messaged me to say he had to interview an SDET, for their iOS product, later that day. He did not know what to ask and what areas he should ask them to dive into. Did I have any suggestions?

So, over Twitter I gave a couple quick ideas on what to ask.  Here is that list, expanded a little.
  • What frameworks have they used to test iOS?
    • Compare the differences between those frameworks.
    • Go review this answer on stack overflow about iOS Testing. This will give you a rundown of the testing frameworks and tools for iOS.
    • What are the pros of those frameworks? What are the cons? And the next question...
  • Have they done UI Automation testing? How? What were the results of that testing?
  • How do they manage their tests? It should be better than I don't. Tools used to track the tests to know what coverage you have is essential.
  • How do they report on them? Not much good doing tests without being able to report on the results.
  • What are the different granularities of tests and how have they used them in past positions? Which do they find the most useful for iOS?
    • Unit Tests
    • Functional Tests
    • End To End Tests
    • UI Automation Tests
    • Manual/Adhoc Testing
  • What difficulties have they had testing iOS?
    • Or maybe the more blunt; What have they found to be unsuccessful or not of value when testing iOS?
    • Ask this since it might highlight the one area you want to concentrate on they might hate.
  • I have seen testers write great and sometimes not so great bug reports. 
    • How do they log a bug? 
    • What information is important? 
    • They should have an opinion on what to include.
  • Most iOS apps use a web service back end of some kind. How do they test the results of web service calls?
    • They should be saying Charles (or alternative packet sniffer like WireShark) here and using a proxy to sniff the HTTP packet flow.
  • Whiteboard time
    • Give them a simple method (Objective-C based please), just the definition and what the method is supposed to return.
      • For example, something that takes a string and returns a sorted array that includes each unique word found in the string. I just has to be complex enough to cause them to write several examples.
    • Ask them to write testcases for this method.
    • Do they know the syntax of Test::Unit style or RSpec style?
  • Can they program? If not, then you don't want them as an SDET. The whiteboard coding question should be a breeze for them.
  • Do they know scripting languages? Ruby? Python? Javascript? 
    • They should since the tools built on top of Apple's iOS testing frameworks are normally written in a scripting language.
    • They will also need to integrate tests with build systems which means command line knowledge and the ability to script command line jobs.
That was the short list I came up with with some additions once I expanded on the brief Twitter exchange.

Anything else you'd look for or ask?

Friday, July 25, 2014

Snooping On Mac OS X Apps

On iOS an app is limited in scope to it's sandbox (unless you are on a jailbroken device) and so you can take a quick look at the apps filesystem within Xcode to see what it is storing. This is not so for the keychain but you can guess the keychain is in use if the app links the Security.framework.

Now, for Mac OS X, since the app may have access to more resources it can be harder to track down what resources the app you are testing is using. There are a couple ways to figure this out though. Here are the ways I use to get an idea what resources a Mac OS X app is using:

  • Activity Monitor.app
    • Launch Activity Monitor
    • Find your app
    • Double click it
    • Choose the "Open File and Ports" tab.
    • See what the app has open currently
  • Use Dtrace
    • This is the long bread method of finding out what your app is doing.
    • Even better you can trace all file opens on a specific process (meaning you get a trace of the opens int eh terminal).
    • To do this open Terminal.app
    • This command must be run as root so I will show you the command with sudo at the front which will prompt the terminal to ask for your root password to complete the command:
      • sudo opensnoop
Here is sample output from opensnoop:
sudo opensnoop
  UID    PID COMM          FD PATH                 
   89  72769 mdworker       7 /Developer/Platforms/iPhoneSimulator.platform/Developer/SDKs/iPhoneSimulator4.3.sdk/System/Library/Frameworks/OpenGLES.framework/glp_sh_interposer.dylib.dSYM/Contents 
   89  72769 mdworker       7 /Developer/Platforms/iPhoneSimulator.platform/Developer/SDKs/iPhoneSimulator4.3.sdk/System/Library/Frameworks/OpenGLES.framework/glp_sh_interposer.dylib.dSYM/Contents/Resources 
   89  72769 mdworker       7 /Developer/Platforms/iPhoneSimulator.platform/Developer/SDKs/iPhoneSimulator4.3.sdk/System/Library/Frameworks/OpenGLES.framework/glp_sh_interposer.dylib.dSYM/Contents/Resources/DWARF 
   89  72769 mdworker       7 /Developer/Applications/Xcode.app/Contents/Library/Spotlight/uuid.mdimporter

Notice that you get the User ID, the Process ID, the Process (COMM), the File Descriptor, and the Path to the file that was opened.

You can play with opensnoop to limit by process name, process id, etc.  Here is the usage output:
USAGE: opensnoop [-a|-A|-ceghsvxZ] [-f pathname]
                 [-n name] [-p PID]
       opensnoop                # default output
                -a              # print most data
                -A              # dump all data, space delimited
                -c              # print cwd of process
                -e              # print errno value
                -g              # print command arguments
                -s              # print start time, us
                -v              # print start time, string
                -x              # only print failed opens
                -Z              # print zonename
                -f pathname # pathname name to snoop
                -n name # process name to snoop
                -p PID # process ID to snoop
  eg,
       opensnoop -v             # human readable timestamps
       opensnoop -e             # see error codes
       opensnoop -f /etc/motd   # snoop this file only

I like to use this by process name, start the process, run the app a bit to exercise most of the functionality, and then look at what opensnoop found. Turn on printing of the errno values and you can see if any file opens are failing.

Come to think of it, another Dtrace script I love is errinfo. This one will show you system calls that are returning an error. It is a good one to use when you know the name of a process having a problem. For example, I once worked with a app that was not logging when it launched another process but the process never started. Missed error checking aside, I used this to show that the exec was failing due to a permission error. The permissions on the sub-process were not set correctly and the other process, running as a different user could not exec the process since it did not have the correct permissions. We fixed the missing error checking and the permission error and all was well.

If you want to know what Dtrace scripts your Mac has then run "apropos Dtrace". Here is what my Mac is showing for Mavericks:
Tcl_CommandTraceInfo(3tcl), Tcl_TraceCommand(3tcl), Tcl_UntraceCommand(3tcl) - monitor renames and deletes of a command
bitesize.d(1m)           - analyse disk I/O size by process. Uses DTrace
cpuwalk.d(1m)            - Measure which CPUs a process runs on. Uses DTrace
creatbyproc.d(1m)        - snoop creat()s by process name. Uses DTrace
dappprof(1m)             - profile user and lib function usage. Uses DTrace
dapptrace(1m)            - trace user and library function usage. Uses DTrace
diskhits(1m)             - disk access by file offset. Uses DTrace
dispqlen.d(1m)           - dispatcher queue length by CPU. Uses DTrace
dtrace(1)                - generic front-end to the DTrace facility
dtruss(1m)               - process syscall details. Uses DTrace
errinfo(1m)              - print errno for syscall fails. Uses DTrace
execsnoop(1m)            - snoop new process execution. Uses DTrace
fddist(1m)               - file descriptor usage distributions. Uses DTrace
filebyproc.d(1m)         - snoop opens by process name. Uses DTrace
hotspot.d(1m)            - print disk event by location. Uses DTrace
httpdstat.d(1m)          - realtime httpd statistics. Uses DTrace
iofile.d(1m)             - I/O wait time by file and process. Uses DTrace
iofileb.d(1m)            - I/O bytes by file and process. Uses DTrace
iopattern(1m)            - print disk I/O pattern. Uses DTrace
iopending(1m)            - plot number of pending disk events. Uses DTrace
iosnoop(1m)              - snoop I/O events as they occur. Uses DTrace
iotop(1m)                - display top disk I/O events by process. Uses DTrace
kill.d(1m)               - snoop process signals as they occur. Uses DTrace
lastwords(1m)            - print syscalls before exit. Uses DTrace
loads.d(1m)              - print load averages. Uses DTrace
newproc.d(1m)            - snoop new processes. Uses DTrace
opensnoop(1m)            - snoop file opens as they occur. Uses DTrace
pathopens.d(1m)          - full pathnames opened ok count. Uses DTrace
perldtrace(1)            - Perl's support for DTrace
pidpersec.d(1m)          - print new PIDs per sec. Uses DTrace
plockstat(1)             - front-end to DTrace to print statistics about POSIX mutexes and read/write locks
priclass.d(1m)           - priority distribution by scheduling class. Uses DTrace
pridist.d(1m)            - process priority distribution. Uses DTrace
procsystime(1m)          - analyse system call times. Uses DTrace
runocc.d(1m)             - run queue occupancy by CPU. Uses DTrace
rwbypid.d(1m)            - read/write calls by PID. Uses DTrace
rwbytype.d(1m)           - read/write bytes by vnode type. Uses DTrace
rwsnoop(1m)              - snoop read/write events. Uses DTrace
sampleproc(1m)           - sample processes on the CPUs. Uses DTrace
seeksize.d(1m)           - print disk event seek report. Uses DTrace
setuids.d(1m)            - snoop setuid calls as they occur. Uses DTrace
sigdist.d(1m)            - signal distribution by process. Uses DTrace
syscallbypid.d(1m)       - syscalls by process ID. Uses DTrace
syscallbyproc.d(1m)      - syscalls by process name. Uses DTrace
syscallbysysc.d(1m)      - syscalls by syscall. Uses DTrace
topsyscall(1m)           - top syscalls by syscall name. Uses DTrace
topsysproc(1m)           - top syscalls by process name. Uses DTrace
weblatency.d(1m)         - website latency statistics. Uses DTrace

Have fun with Dtrace, it can open up your debugging and give you a view into processes you don't own.

Wednesday, July 23, 2014

Breaking Mac Apps

One of the reasons I took my current gig as a Software Development Engineer Test (SDET) was so I could learn more about my craft of software development. Too often as the developer under stress to get something out the door it can be tempting to do the minimum testing possible to get the feature out the door. That temptation is tempered by the fact that you know if you ship crap then you will have more headaches than spending the extra time now to get it right.

So, I wanted to concentrate on breaking a product too see what I learn by finding it's rough spots. This has been fun at times in the sense that I am actually learning ways to more effectively test my own software. I plan to use this knowledge to write better software myself.

I am currently testing a product on both Mac OS X and iOS. As a dev I have some things I learned from writing Mac apps that I have been able to put to use in my job as a tester.

One of those is to always test the First Run case. What is this? The First Run test involves running the app as if you were a new user installing and running the app for the first time.

How to do this on Mac?

  • Does the app use the Keychain to store anything? Find out and make sure to clear it before you run the test.
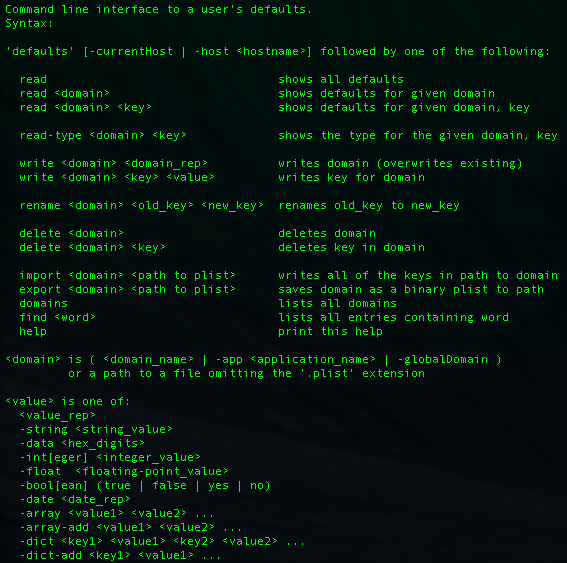
  • Does the app use the User Defaults to store anything? Probably, so go learn the command line tool defaults. Here is a short primer:
    • Open Terminal.app
    • Run this: defaults
      • Now you have the standard usage (screenshot shown above).
    • If you app's defaults are stored in the domain "com.mycompany.myapp" then type this to view what the app is storing: 
      • defaults read com.mycompany.myapp
    • Now before a First Run test run this to clear the stored setting: 
      • defaults delete com.mycompany.myapp
  • Does your app use any other storage? SQLLite for example? CoreData store?
    • Find out, find out where the files are stored and then delete them before you run a First Run test.
Run the test and see what blows up.

Too often we forget to retest this scenario as we work on features and the simple First Run case can get broken.

Test it often to weed out problems before new users find them.  I always run this on candidate builds for a new release to end users. I am also always surprised when this breaks since we seldom think the simple changes we are making in our app will break the First Run.